Nonprofit Impact Data
Data Visualization & Impact Storytelling
Created for Main Street Ventures, a nonprofit that nurtures early-stage entrepreneurs, particularly from underrepresented backgrounds by providing access to capital through Grants, coaching, and advocacy to support economic development. Located in Cincinnati, Ohio.
Main Street Ventures releases an Annual Report to showcase Grant Funding distributed, Support Program Success, and Financial Supporters. To focus on the impact of Main Street Ventures, a two-page spread of the Annual Report is dedicated to showcasing key success metrics. Donors and Community Stakeholders receive this publication in digital and print formats.
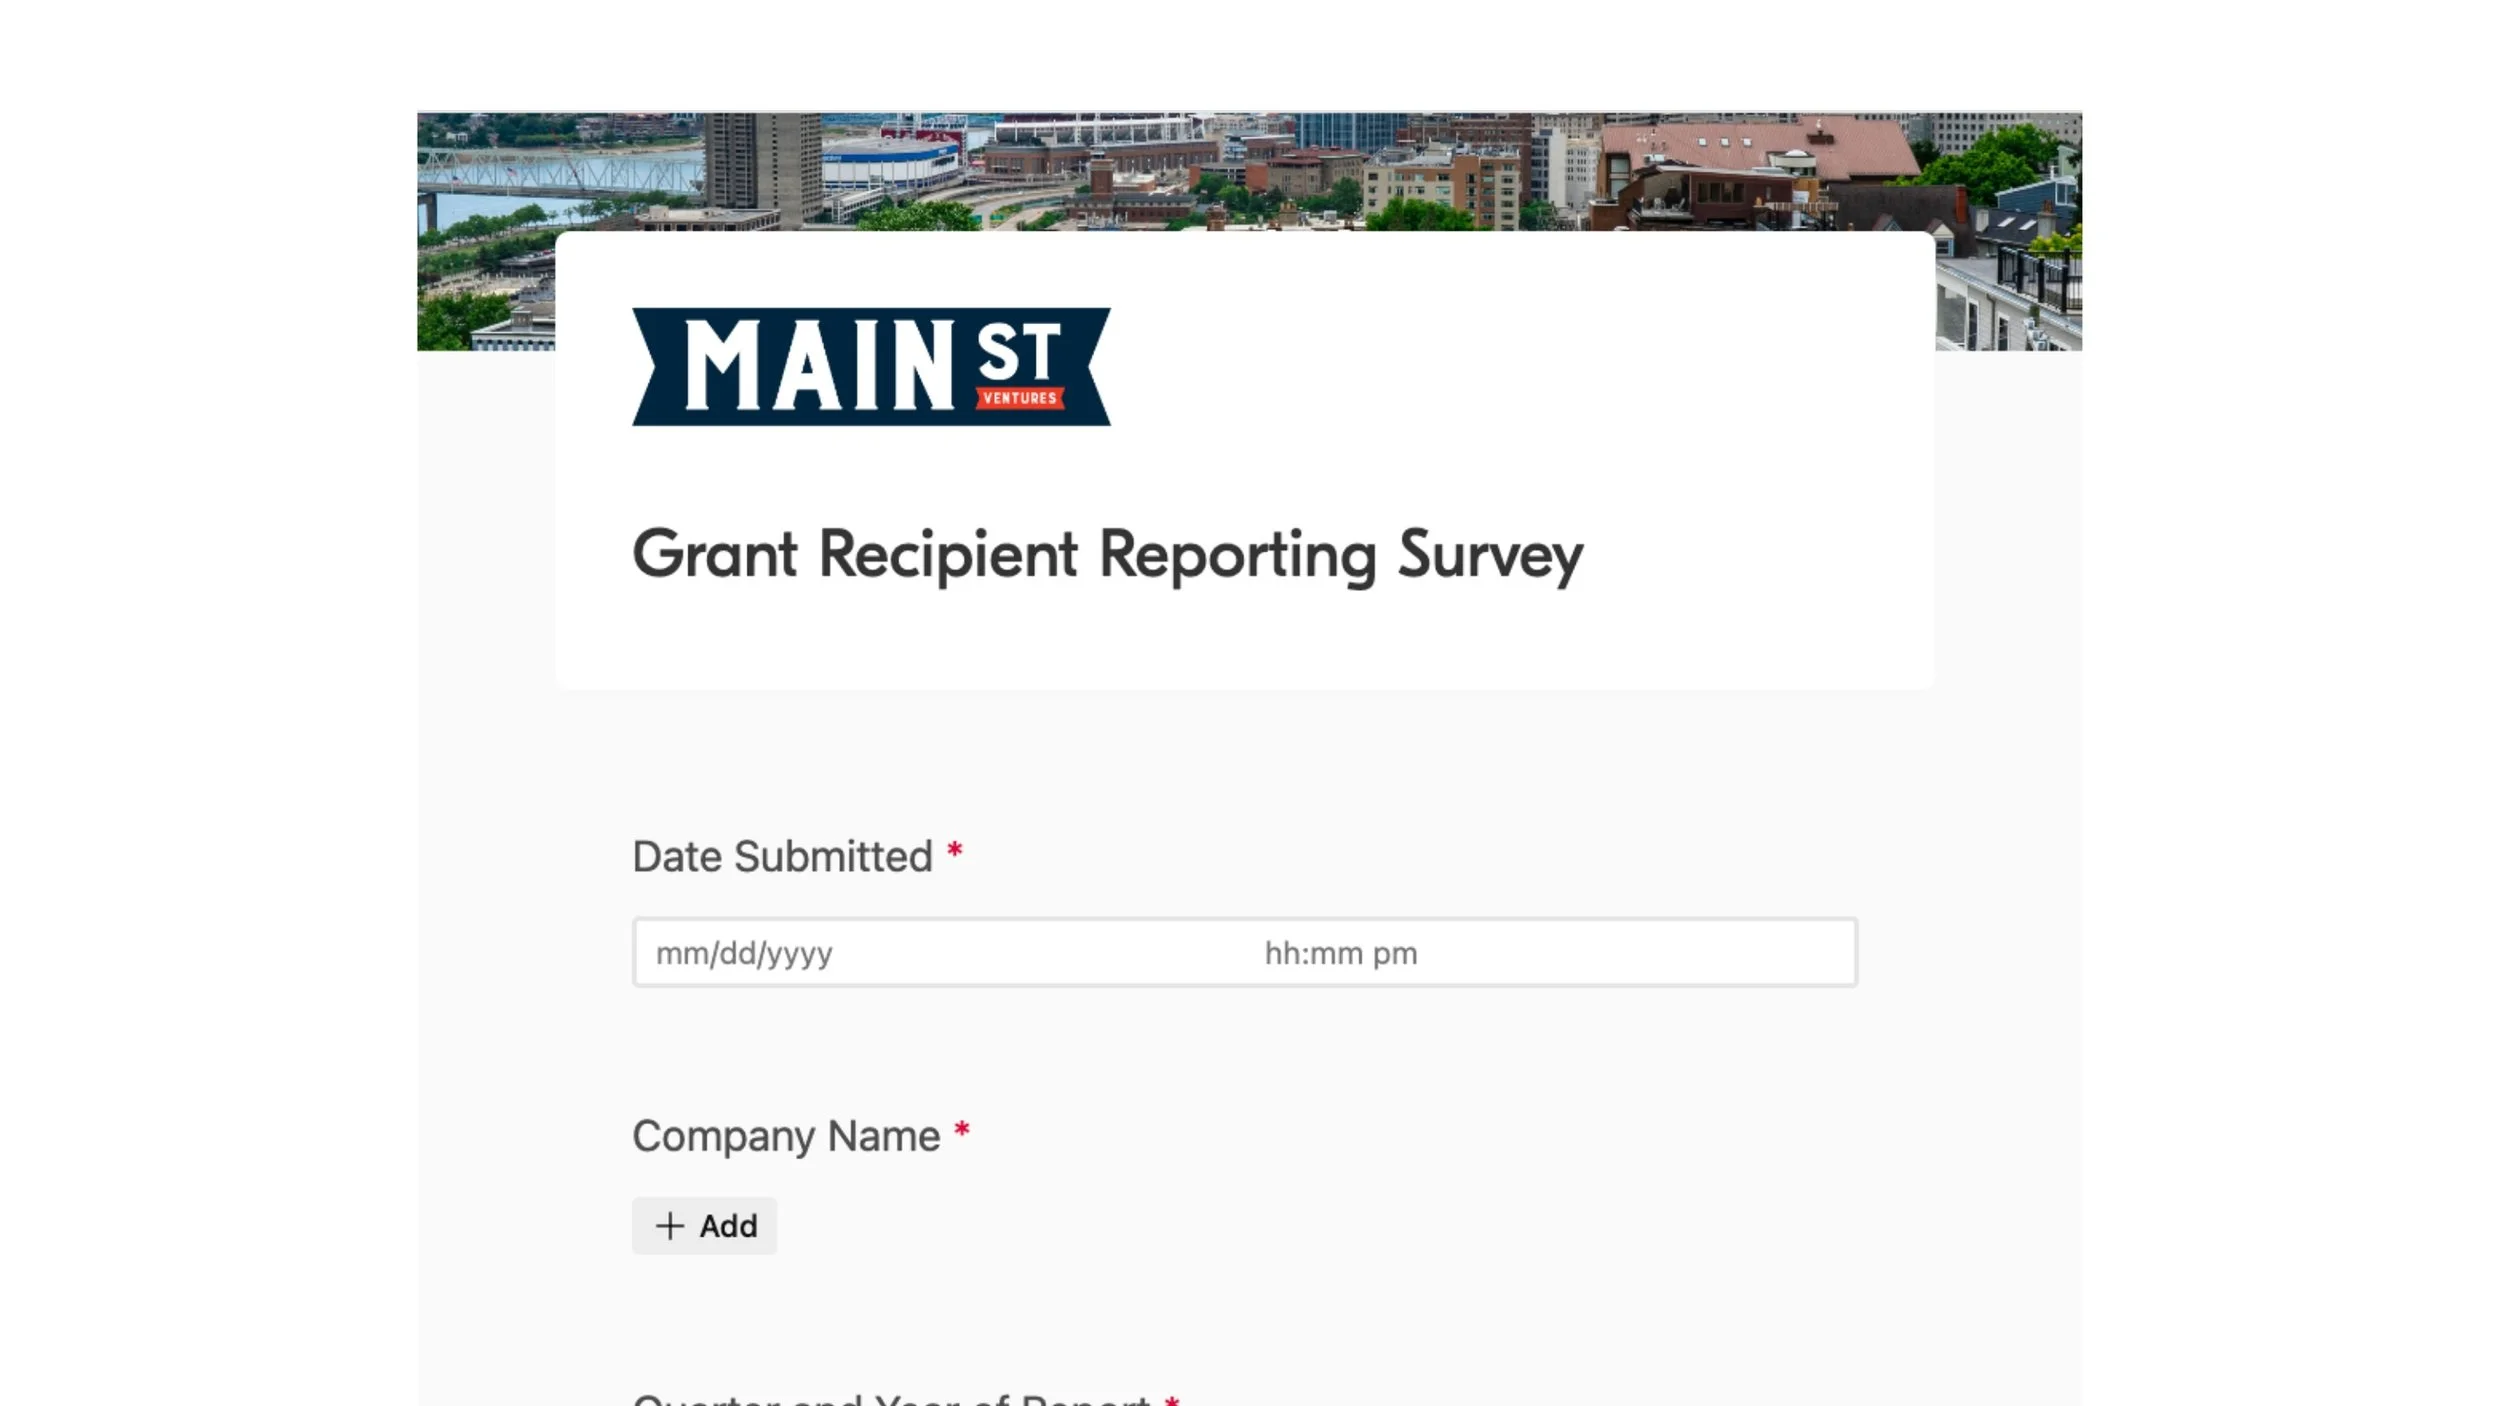
The organization’s metrics directly come from the for-profit Grant Recipient Companies that receive funds. Each Grant Recipient company submits quarterly data through an online form. Once submitted, the metrics are aggregated and analyzed through comprehensive data dashboards created in the platform Airtable. Once the data is analyzed, key metrics are selected to highlight in a two-page spread in the Annual Report created in Adobe InDesign.
Role
Project Lead, Data Collector, Data Analyst, Data Dashboard Builder
Tools Used
Airtable, Adobe InDesign, Adobe Illustrator, Microsoft Excel
Background
In the Acess to Capital for Entrepreneurs: Removing Barriers | 2023 Report by the Ewing Marion Kauffman Foundation…
83% of new businesses with employees lack access to capital.
16% of Black-owned businesses’ financing needs are met, compared with 48% of white-owned businesses.
As the impact of Main Street Ventures evolves, it is important to show how the outcomes of current programs challenge these national statistics. Main Street Ventures’ Grant Funding Programs provide equity-free capital to businesses with a focus on underrepresented founders who may face significant barriers in securing capital for their business.
Project Scope
Project Goals
The Main Street Ventures Annual Report Data Page visualizes a year of the organization’s impact. To achieve this, the project focused on three key goals determined by the mission statement of Main Street Ventures:
Showing the support of Underrepresented Founders
Promoting Economic Development
Demonstrating Program Effectiveness
Research Methods
Primary Research
Grant Recipient Survey for Quantitative and Qualitative Data
Secondary Research
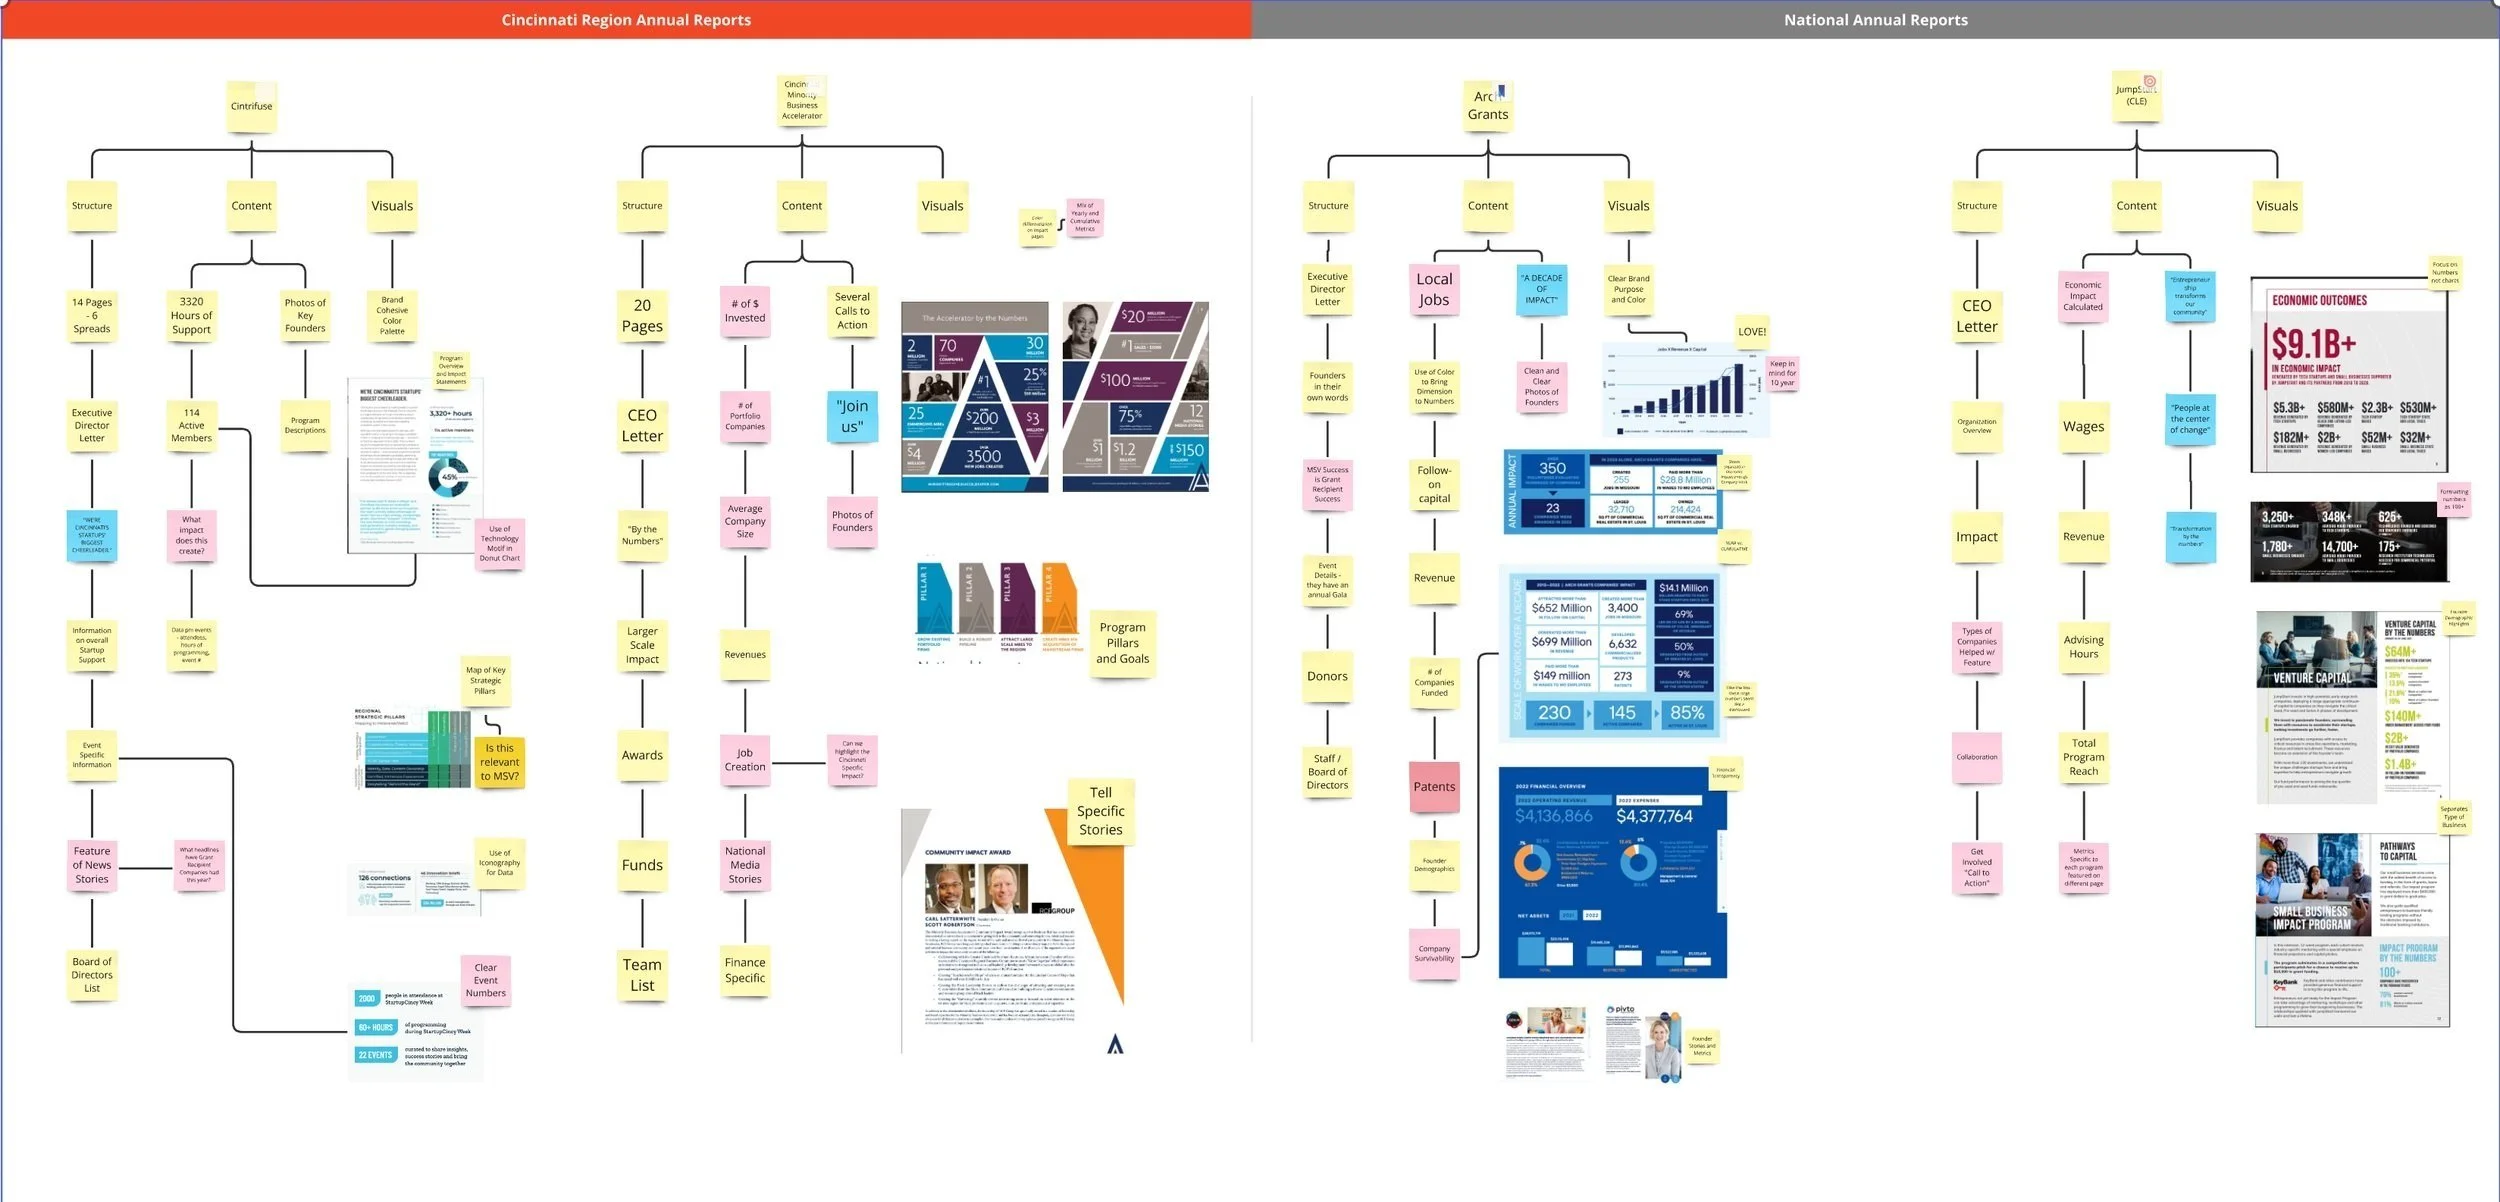
Benchmarking Related Annual Reports for Content, Layout, and Metrics
Project Outcome
The Annual Report Data Page successfully visualized a year of Main Street Ventures' impact, effectively communicating the organization's achievements to its stakeholders. By focusing on supporting underrepresented founders, promoting economic development, and demonstrating program effectiveness, the visualization provided a clear and compelling picture of the organization's positive influence.
Process Overview
RESEARCH
Benchmark
Grant Recipient Survey
DATA ANALYSIS
Small Business Data Analysis
Metric Selection
IDEATION & ITERATION
Chart & Graph Generation
Layout Design
REFINEMENT
Finalize the Data Impact Story
Publish Annual Report
RESEARCH
Benchmarking Nonprofit Annual Reports (Secondary Research)
To benchmark industry standards and identify opportunities for differentiation, I conducted a comprehensive analysis of annual reports from similar nonprofit organizations nationwide and locally to identify industry best practices, emerging trends, and unique opportunities for differentiation.
By understanding other organizations, I could identify Main Street Ventures' competitive advantages, such as its focus on underrepresented entrepreneurs and robust data-driven approach to measuring impact.
This benchmarking process informed the design and content decisions for the annual report, ensuring that it would stand out and effectively communicate the organization's unique value proposition.
Small Business Data Collection (Primary Research)
I developed a detailed online survey to collect comprehensive data from Grant Recipients to understand the impact of Main Street Ventures.
This survey captured 4,000+ data points from 200+ Grant Recipients, providing quantitative and qualitative insights into each company's state at the end of each quarter.
By carefully designing the survey and validating each measure, I ensured the collected data would be reliable, setting the stage for robust analysis and visualizations.
Small Business Data Analysis
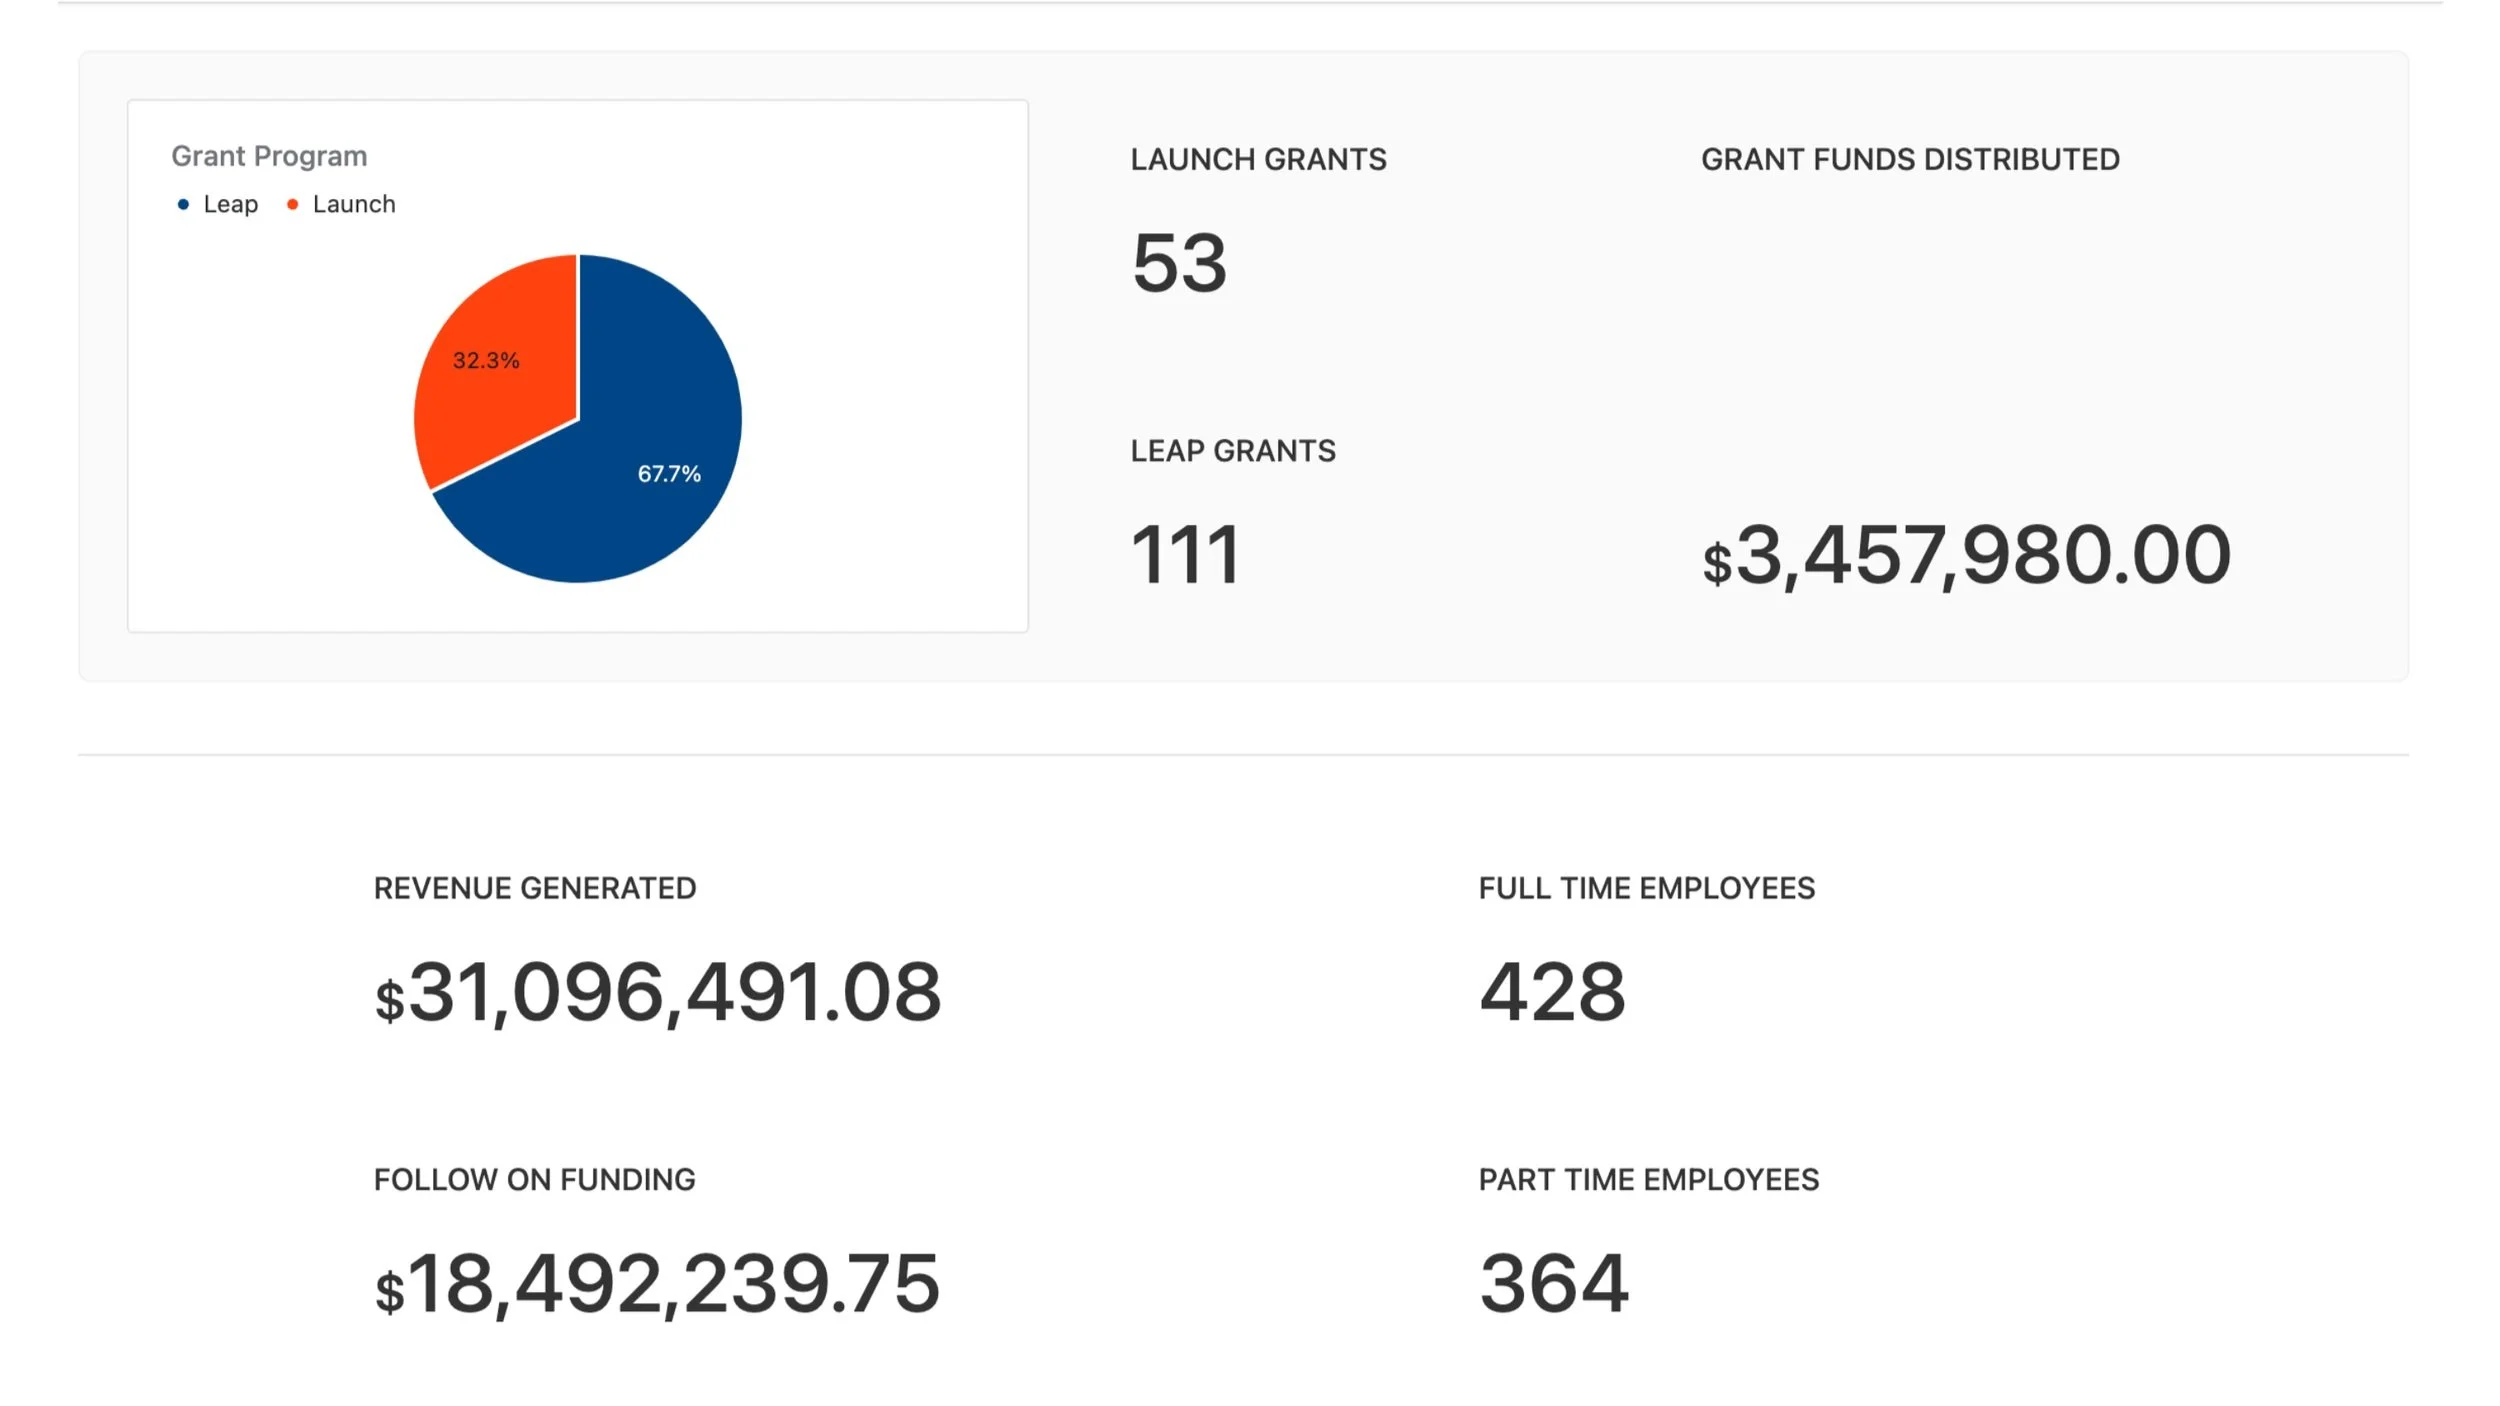
To better understand the impact data, I analyzed the data by various qualifiers, such as founder demographics, industry type, and company stage. By looking at different segments, I identified patterns and trends that in-depth patterns and trends. For example, I could determine which types of business yielded the best results for job creation, raising follow-on funding, and generating sales. These insights were crucial in shaping the narrative of the data visualization and highlighting the program's effectiveness in supporting diverse entrepreneurs.
*data highlighted below is AI generated sample data, but is reflective of the data type analyzed
DATA ANALYSIS
Narrowing Down Metrics for Impact Storytelling
After understanding the large volume of metrics, I narrowed the list to ensure alignment with the organization's mission and the desired narrative. By comparing each metric against the key goals of supporting underrepresented entrepreneurs, promoting economic development, and demonstrating program effectiveness, I narrowed the focus to a select group of the most impactful measures: # of Grants Awarded, % of Underrepresented Founders, # of Jobs, $ Follow on Funding Raised, and $ Sales. These metrics were then curated to form a compelling data story highlighting the success of Grant Recipients and Main Street Ventures.
Chart & Graph Generation
I generated the visualizations for the two-page spread using a combination of Airtable and Microsoft Excel. I leveraged Airtable's built-in visualization tools for simple charts and graphs to quickly create clear and concise data representations. For more complex visualizations, I exported the data from Airtable to Excel, where I had greater flexibility to customize charts and graphs using advanced charting techniques.
Once the visualizations were created in Airtable and Excel, I imported them into Adobe Illustrator to further refine their aesthetic appeal and ensure alignment with the overall design. These polished visualizations were then seamlessly integrated into the final two-page spread in Adobe InDesign.
IDEATION & ITERATION


Layout Design
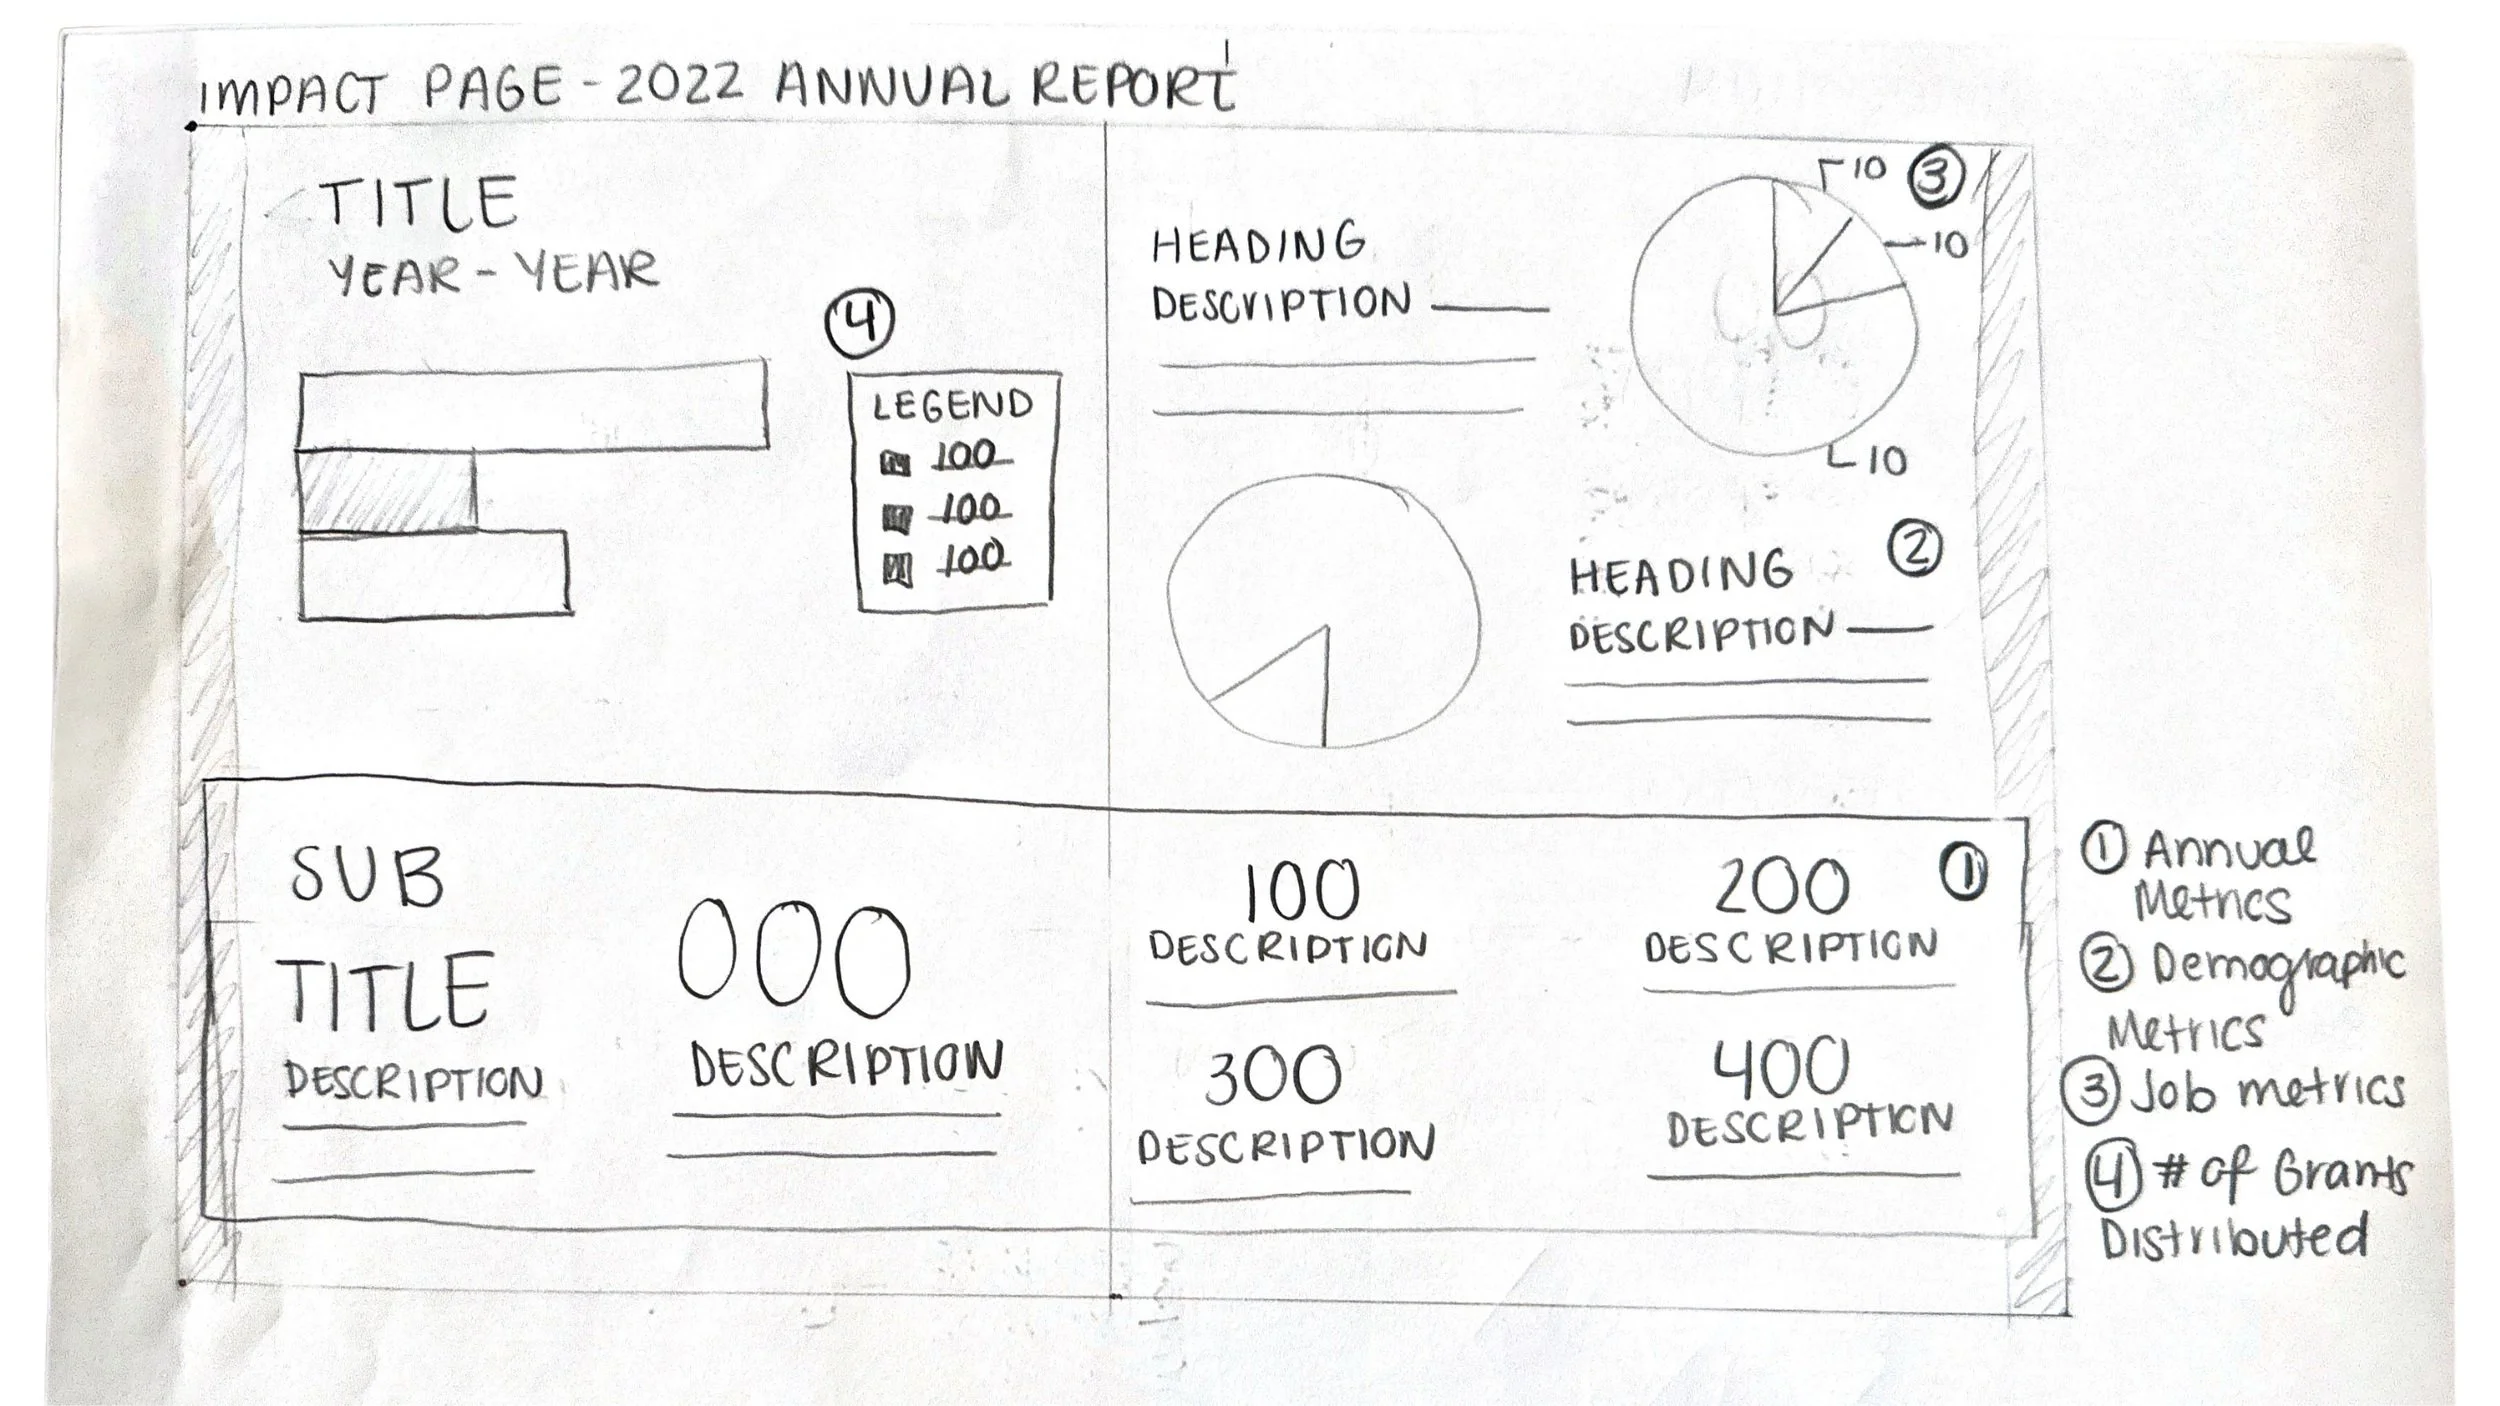
I designed a visually engaging and informative two-page spread using a data dashboard approach. This allowed for a clear and concise presentation, making it easy for stakeholders to understand.
I iterated on several layout designs, experimenting with different arrangements of charts and graphs. Each layout told a slightly different story, emphasizing various aspects of the data. I prioritized the 2018-2023 data to build credibility and establish a strong foundation for the narrative. Subsequently, I delved into different information segments, such as founder demographics, industry type, and company stage, providing a more comprehensive overview. By strategically placing visualizations and leveraging the Main Street Ventures Brand, I created a visually appealing and professional design that effectively communicated the data story.
IDEATION & ITERATION


Finalizing the Impact Data Story
To finalize the project, I meticulously integrated the refined visualizations into the two-page spread in Adobe InDesign. By carefully arranging the elements, I ensured a clear and visually appealing layout that guided the reader's eye through the data story. I paid close attention to the overall design aesthetics, incorporating a consistent color palette and typography to create a cohesive and professional look. The final product was a visually striking and informative two-page spread that effectively communicated the impact of Main Street Ventures' grant program, empowering the organization to share its success story with donors and stakeholders.
REFINEMENT


